Population genetics
We used 2039 samples from rural areas of the British Isles, from people whose four grandparents were all born within 80km (50 miles) of each other. After over a decade of sample collection and data analysis, the findings of the study were published in Nature on the 19th of March 2015.
We were absolutely astonished to obtain 17 clusters of individuals based solely on similarities in their DNA that matched remarkably well their geographical locations.
The map shown in Figure 1 is a plot of all the individuals at the average position of their grandparents’ place of birth, where different groups are represented by the combination of the type of symbol and its colour.
The most striking observation is the extraordinary correspondence between the genetic clusters and geographical location.
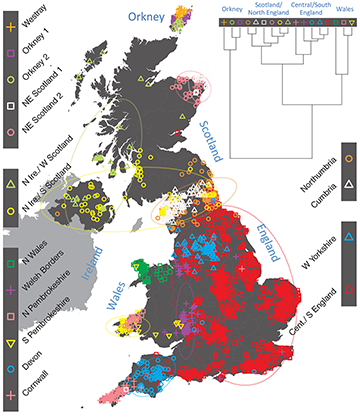
Figure 1.
By successively merging the most similar clusters a hierarchical cluster tree was obtained as shown in the upper right hand part of Figure 1.
Here, the groups that are most similar have the shortest branches between them, as for example the three clusters in Orkney (purple squares, green circles and orange crosses), and the two in South Wales (pink squares and inverted yellow triangles).
Interestingly, based on this hierarchical clustering, north and south Wales are about as distinct genetically from each other as are central and southern England from northern England and Scotland, and the genetic differences between Cornwall and Devon are comparable to or greater than those between northern English and Scottish samples.
The most different of all the clusters from the rest of the UK are those found in Orkney, what clearly corresponds to the existence of a Norse Viking Earldom in Orkney from 875 to 1472.
The next level of separation shows that Wales forms a distinct genetic group, followed by a further division between north and south Wales. This division corresponds well with the ancient kingdoms of Gwynedd (independent from the end of the Roman period to the 13th century) in the north and Dyfed in the south.
Subsequently, the north of England, Scotland, and Northern Ireland collectively separate from southern England. Then, at the next level, Cornwall forms a separate cluster quite distinct from Devon, followed by Scotland and Northern Ireland separating from northern England.
The split in the Northern Ireland group, one with the Scottish highlands and the other with the lowlands, suggests association with the people of Dalriada and with the Picts, respectively, a separation of clans that existed around 600 AD. The split in south Wales (pink squares and yellow inverted triangles) is suggestive of “Little England beyond Wales”.
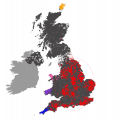
Particularly striking is the distribution of the large cluster of people (red squares) that covers most of eastern, central and southern England and extends up the east coast. This cluster contains almost half the individuals analysed (1006).
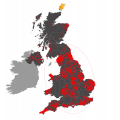
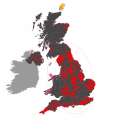
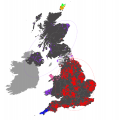
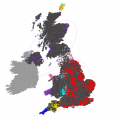
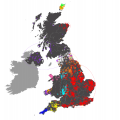
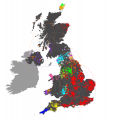
Please look through the gallery below to see the clustering in detail.
Several of the other genetic clusters show similar locations to the tribal groupings and kingdoms around at the time of the Saxon invasion (from the 5th century), suggesting that these tribes and kingdoms may have maintained a regional identity for many centuries. For example the Cumbrian cluster corresponds well to the kingdom of Rheged, West Yorkshire to the Elmet and Northumbria to the Bernicia (see Figure 2)
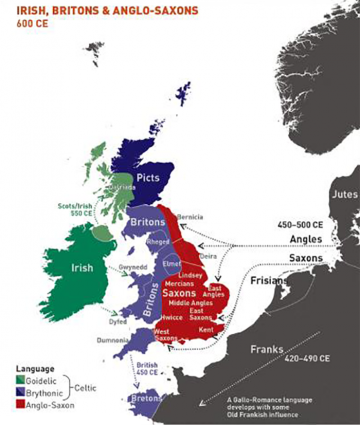
Figure 2.
The existence of these largely quite well separated clusters suggests a remarkable stability of the British people over quite long periods of time. This is in marked contrast to what is often assumed.
It is important to emphasize that, although the genetic clustering found by our analysis is based on very small genetic differences, it represents a major step forward in the genetic analysis of human populations.
To understand the relationships of the clusters to each other we need to consider the history of the British people and the possible contributions to their genetic makeup from the surrounding European countries.
Data from a study of multiple sclerosis on 6,209 individuals from 10 different European countries were used to assess the extent to which these European countries might have contributed to the genetic composition of the British genetic clusters. These data were first clustered into genetic groups on the basis of genetic similarity. Out of 51 groups identified by FineStructure software only 9 contributed significantly to the British clusters. An image below shows the extend of European contribution to the British clusters. Each pie chart represents one of the 17 British clusters and the relative contributions of the different European groups to that cluster are proportional to the sizes of the sectors in the pie chart, with the colour of the sector indicating its source.
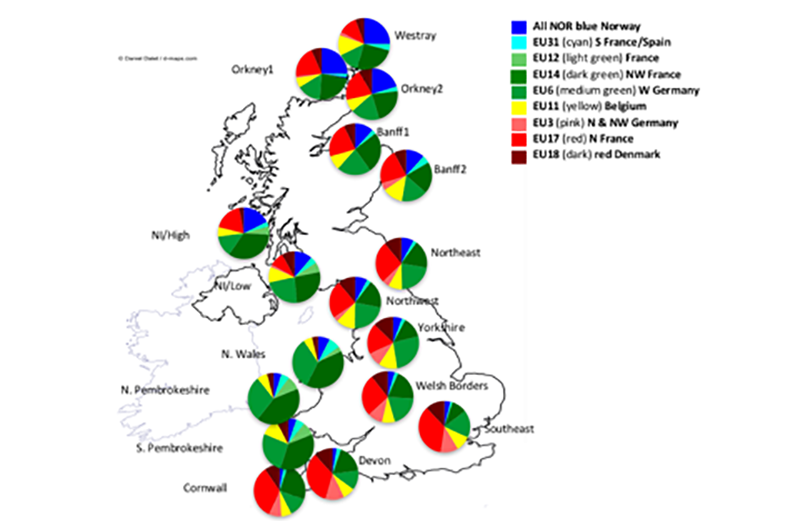
Figure 3.
The dark blue Norwegian contribution stands out clearly in the Orkney samples, as expected, but represents only about a 25% Norse Viking admixture. This shows that the Norse Vikings certainly did not wipe out the resident Pictish population and replace it, but rather intermarried significantly with it. There are also clear Norwegian contributions to all the Scottish and Northern Ireland samples, less to Northern England, even less to Wales and very small contributions elsewhere.
The three Welsh clusters are the most distinctive and completely lack contributions from North and North West Germany (EU3 pink) and Northern France (EU17 red). They have the largest contributions from West Germany (EU6 medium green) and North West France (EU14 dark green). This configuration strongly suggests that the Welsh may be closest to the original settlers who came to Britain after the end of the ice age. While there is no clear ‘Celtic Fringe’, as is so often assumed, there is evidence of ancient British DNA in common with other British populations, especially in Scotland and Northern Ireland, but less in Cornwall, or Devon, in contrast to what might have been expected.
The small differences between South and North Pembrokeshire, especially the slightly larger contributions from Belgium (EU11 yellow) and Denmark (EU18 dark red) (matching Danish place names in South Pembrokeshire) are consistent with the suggestion that this group may represent the area that is sometimes called “Little England Beyond Wales”. This is because the farmers settled there by Henry II probably mostly came from that part of Europe.
The most obvious contribution representing the Anglo-Saxons is EU3 (pink) from North and North West Germany. That is consistent with the lack of evidence for Anglo-Saxon incursions into Wales. Denmark (EU18 dark red) is another clear candidate for an Anglo-Saxon contribution. Based on these two contributions, the best estimates for the proportion of presumed Anglo-Saxon ancestry in the large eastern, central and southern England cluster (red squares) are a maximum of 40% and could be as little as 10%. This is strong evidence against an Anglo-Saxon wipe-out of the resident ancient British population, but clearly indicates extensive admixture between the incoming invaders and the indigenous people. The difference between Devon and Cornwall is most probably due to the greater Saxon influence in Devon, this being consistent with the slightly greater contributions of EU3 (pink) and EU18(dark red) to the makeup of the Devon cluster as compared to that in Cornwall.
The homogeneity of the east, central and southern British cluster (red squares) with no obvious differences in the Danish contribution (EU18 dark red) between them and the more northern English populations, strongly suggests that the Danish Vikings, in spite of their major influence through the “Danelaw’ and many place names of Danish origin, contributed little of their DNA to the English population.
There is evidence for only a very small Spanish contribution to the PoBI samples, in contrast to what has been claimed by some authors.
The most intriguing European contribution is that from Northern France, (EU17 red). This clearly post- dates the original settlers since it is entirely absent from the Welsh samples. It is, however, widespread elsewhere, even right through the north of England and Scotland to Orkney. It is also especially prevalent in Cornwall and Devon. These results suggest a previously not described substantial migration across the channel after the original post-ice-age settlers but before Roman times. DNA from these migrants spread across England, Scotland, and Northern Ireland, but had little, if any, impact on Wales.

